How do you make a line plot with fractions?
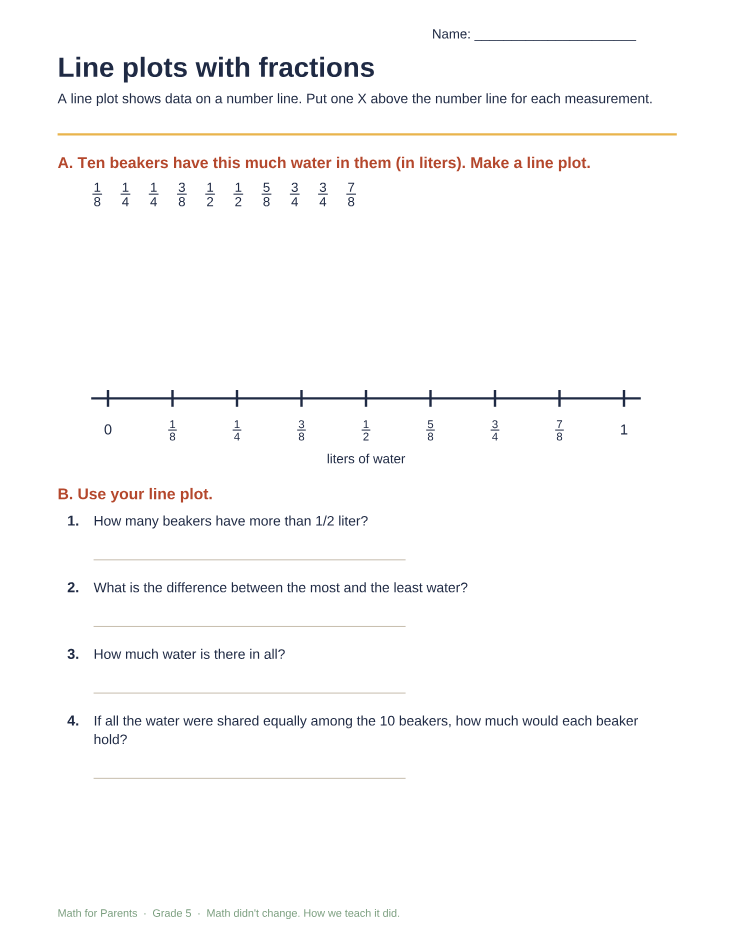
A line plot shows data on a number line, with an X above the line for each measurement. In 4th and 5th grade the measurements are fractions like 1/8, 1/4, and 1/2, so kids also practice adding and comparing fractions to answer questions about the data.

How you probably learned it
You may have made bar graphs in school, but probably not line plots with fractions.
How your kid is learning it
Your kid measures real things (like water or pencil lengths) to the nearest eighth, plots them, and then uses fraction math to answer questions like "how much water is there in all?"
Reading a line plot
Each X is one measurement. A stack of X's means that value came up more than once. The distance between the highest and lowest X shows how spread out the data is.
The 5th-grade twist: sharing equally
A common question: if all the water were poured together and shared equally, how much would each beaker hold? Add all the measurements, then divide by how many there are. That is finding the average, though kids usually won't call it that until 6th grade.