How do you graph points on a coordinate grid?
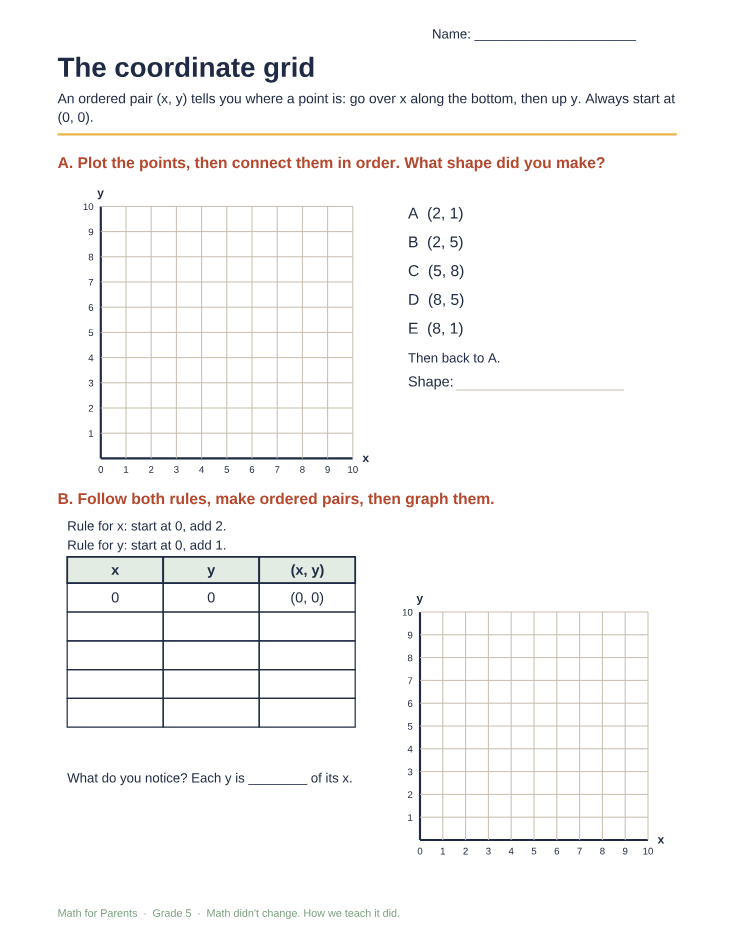
A coordinate grid is two number lines that cross at zero. An ordered pair like (3, 4) gives a point's address: start at (0, 0), go over 3 along the bottom (the x-axis), then up 4 (the y-axis).

How you probably learned it
You may remember plotting points in middle school, often with a rule you no longer remember.
How your kid is learning it
5th graders learn the first quadrant, where both numbers are positive. They plot points, and they turn number patterns into ordered pairs and graph them to see the pattern.
The one rule that matters: x first
The first number tells you how far to go across. The second tells you how far to go up. A common saying: you walk to the elevator (across) before you ride it (up).
Patterns become pictures
One rule might be "start at 0, add 2" (0, 2, 4, 6) and another "start at 0, add 1" (0, 1, 2, 3). Pair them up: (0, 0), (2, 1), (4, 2), (6, 3). On a graph the points line up in a straight line, and kids notice each y is half its x.